
How Much Money Do I Need to Retire?
 Lorenzo Foti
"How much money do I need to retire?" sounds like a question that should have a golden number as an answer.
£500,000. £1 million. Twenty-five times annual spending.
These figures can provide a useful reference, but they only become meaningful when they are connected to a specific life. Someone who spends £25,000 a year and expects a substantial pension has a very different requirement from someone who spends £60,000 and plans to stop working decades before any pension becomes available.
The first step is therefore to define what retirement means in the plan.
For one person, it may mean stopping work at 45 and funding most of their remaining life from investments. For another, it may mean leaving work at 60 and using savings to cover the years before the State Pension begins. Someone else may work until pension age and need their portfolio only to supplement the regular income received from the state and previous employers.
All three people are retiring. Their savings have very different jobs to do.
Three different retirement timelines
The earlier employment income ends, the longer savings need to support the plan. It helps to separate three broad situations.
Very early retirement
Someone retiring in their forties or early fifties may need their portfolio to cover several decades before the State Pension begins.
A person retiring at 45 could spend more than twenty years without employment or pension income, followed by another twenty or thirty years of retirement. Their savings may therefore need to support a period of fifty years or more.
Over such a long timeframe, inflation, investment returns and changes in spending can have a large effect. The plan also has less information about distant pension rules, later-life costs and the person's future circumstances.
For very early retirement, the portfolio usually becomes the main source of income for a substantial part of the person's life.
Retirement before pension age
Many people want to stop working several years before their state or workplace pensions begin.
Someone retiring at 60 and receiving a State Pension from 68 needs to fund an eight-year gap. During those first years, savings may provide most or all of their income. Once the pension begins, the annual amount required from the portfolio may fall substantially.
The portfolio therefore performs two jobs. It first acts as a bridge between the final salary and the beginning of pension income. It then supplements that pension for the rest of retirement.
Retirement when pensions begin
Someone who works until their pensions become available may enter retirement with part of their spending already covered.
For example, a person spending £35,000 a year who receives the full UK new State Pension would currently have around £12,500 of annual income from the state, measured at 2026/27 rates. Their portfolio would need to provide the remaining £22,500 a year, before considering any workplace or private pension.
The full new State Pension is £241.30 a week in 2026/27, equal to £12,547.60 a year. The actual amount received depends on the person's National Insurance record.
If workplace or private pensions cover the remaining gap, savings may mainly fund travel, large purchases, emergencies or an inheritance. If they do not, the portfolio continues to provide part of the person's regular income throughout retirement.
The same level of spending can therefore require very different amounts of capital depending on when work ends and when other income begins.
Start with spending and future income
The amount needed for retirement begins with the lifestyle the person wants to fund.
Regular costs may include housing, food, transport and bills, but spending rarely stays completely flat. Travel may be higher during the first years of retirement. A mortgage may end later. Large expenses such as home repairs or replacing a car may occur occasionally. Healthcare or care costs may become more important at older ages.
Separating essential and discretionary spending can make the plan more informative. A person who needs £30,000 for essential costs and would like to spend another £5,000 on travel has some ability to adjust. Someone whose full £35,000 is committed to fixed expenses has less room to respond if markets perform poorly.
The next step is to include income that continues or begins after work. This might include a State Pension, workplace or private pensions, annuities, rental income or part-time work.
A useful first calculation is:
Savings need to cover the gap between annual spending and reliable retirement income.
Suppose someone expects to spend £35,000 a year. From age 68, they expect to receive approximately £12,500 from the State Pension.
This leaves an annual gap of £22,500.
If they retire at 68, their portfolio mainly needs to fund that £22,500 gap.
If they retire at 60, the portfolio initially needs to provide the full £35,000 for eight years. From age 68, the amount required falls to £22,500.
If they retire at 45, it needs to provide £35,000 for twenty-three years before the State Pension begins, followed by £22,500 afterwards.
The spending and pension assumptions are identical. The retirement date changes the amount of work assigned to the portfolio.
Using a withdrawal rate as a first estimate
A common shortcut is to divide the amount required from the portfolio by a chosen "safe withdrawal rate".
The best-known example is the 4% rule, which originated from research published by financial adviser William Bengen in 1994 1. Bengen tested different retirement starting dates using historical US investment returns and inflation. In the commonly cited approach, a retiree withdrew 4% of the initial portfolio during the first year and then increased that cash amount with inflation each year.
The result was based on a 30-year retirement and a portfolio combining US shares and intermediate-term US government bonds. The familiar example uses an equal split between the two, although Bengen also tested different allocations. It described a specific historical exercise rather than a rate designed for every retirement plan.
At a 4% withdrawal rate, the capital required to fund the £22,500 annual gap would be:
At a more cautious 3% withdrawal rate, the estimate rises to:
This provides a useful starting range for someone retiring when their State Pension begins.
Someone retiring at 60 must also fund the eight-year bridge. Eight years of £35,000 spending adds up to £280,000 in today's money, although the required starting capital cannot be calculated by simply adding £280,000 to the long-term portfolio. The money remains invested during those years, while inflation, taxes and market returns continue to affect it.
For someone retiring at 45, the bridge lasts twenty-three years and contains £805,000 of spending before the State Pension begins. At that point, a simple multiple based only on the later £22,500 gap misses most of the plan.
Withdrawal rates are useful because they connect spending with capital. They can indicate whether the likely requirement is closer to £500,000 or £1 million. They become less reliable when income and spending change substantially over time.
The appropriate rate for an individual plan depends on the length of retirement, the mix of investments held, investment fees, taxes, inflation and whether spending can be reduced during difficult periods.
The money must be available when it is needed
The total value of someone's assets does not always equal the amount available for retirement.
A person may hold most of their wealth in a pension account that cannot yet be accessed. If they want to stop working earlier, they need enough money in cash or accessible investments to reach the age when that pension becomes available.
The same applies to property. A valuable home may reduce housing costs and provide financial security, but it funds retirement spending only when the plan includes a way to use its value, such as downsizing, selling or releasing equity.
Taxes also affect the amount available. A £20,000 withdrawal from one account may provide the full £20,000 to spend, while the same withdrawal from another account may create a tax charge.
Two people with the same net worth can therefore have very different retirement positions. The timing, location and tax treatment of their wealth determine how much of it can support spending at each age.
Why a single target is still a simplification
The calculations above help frame the problem, but they still reduce a long financial plan to a set of limited and static assumptions.
Multiplying spending by 25 assumes that the same annual amount must be funded indefinitely. Adding the cost of a bridge assumes that the money follows a predictable path while it is being spent. Both approaches compress future investment returns, inflation and changing cash flows into a small number of assumptions.
A more complete answer needs to leverage a full year by year plan simulation.
It must account for the age at which work stops, when different accounts become accessible, when pensions begin, how spending changes and how the portfolio might perform across many possible market conditions.
It must also answer a question that simple multiples leave open:
How much capital would be enough for this plan to work in 90%, 95% or 99% of simulated futures?
This is the purpose of a capital frontier.
What is a capital frontier?
A capital frontier shows how much money a person would need at each age if they stopped working at that point.
For every age, the calculation looks at the financial life that remains from that moment onwards. Employment income and contributions linked to employment end, while the other cash flows in the plan continue according to their own timing.
These may include the State Pension, workplace and private pensions, rental income, annuity payments, part-time or other income, and any one-off cash receipts expected later. The calculation also continues to include spending, taxes, account-access rules and future costs.
The required capital is then shown at different confidence levels.
At 90%, the frontier shows the amount needed for the plan to fund all planned spending in 90 out of every 100 simulated futures. The 95% and 99% frontiers apply progressively stronger margins of safety.
Connecting these amounts across ages creates the capital frontier.
Rather than producing one retirement number, the chart answers a series of related questions:
- How much would I need if I stopped at 50?
- How much would I need at 55?
- What changes if I continue until 60?
- How much additional capital is required to move from 90% to 95% confidence?
- How expensive would it be to aim for 99%?
Each point on the line represents the amount needed to fund the remaining plan from that age onwards.
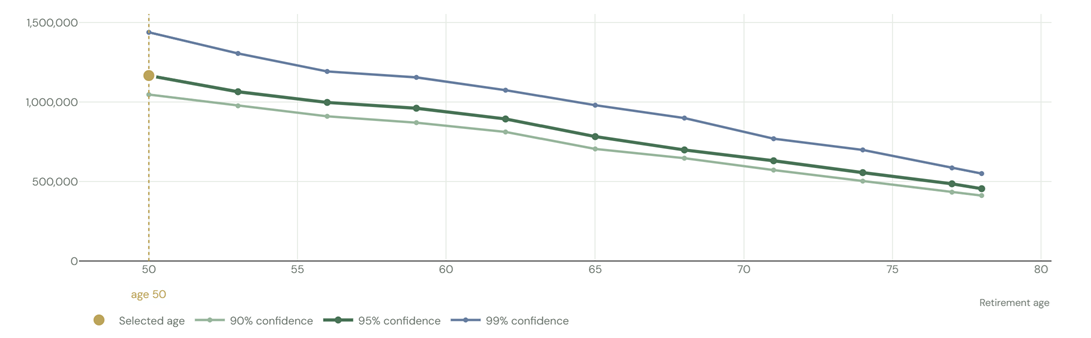
Consider a person spending £35,000 per year, with money invested in a taxable account.
The portfolio is invested 60% in stocks and 40% in bonds. There are no other cash flows, such as rental income or an annuity, and a State Pension worth £12,000 a year in today’s money begins at age 68. The portfolio must cover spending until the pension starts and then fund the remaining gap afterwards, until the age of 90 (see full assumptions 2).
At age 50, the estimated capital requirements are approximately:
- £1.05 million for 90% confidence;
- £1.17 million for 95% confidence;
- £1.44 million for 99% confidence.
The first increase in protection, from 90% to 95%, requires around £120,000 of additional capital. Moving from 95% to 99% requires a further £270,000.
This illustrates how the cost of protection tends to rise as the target approaches "certainty". The 99% frontier must cover almost all the simulated futures, including a small number of particularly difficult combinations of poor returns, inflation and long retirement spending. Protecting against those extreme paths can require considerably more capital than protecting against the broader range represented by the 90% or 95% frontiers.
That cost of additional protection strictly depends on the plan. A person with flexible discretionary spending and strong pension or rental income may see a relatively small gap between the confidence levels. Someone retiring very early with high fixed spending may need considerably more capital to move from 90% to 99%.
The highest percentage is not automatically the right target. It may require several additional years of work or a much lower standard of living today. The chart allows that trade-off to be seen rather than hidden inside a single conservative assumption.
Why the required capital changes with age
In today's purchasing power, the capital frontier will generally decline as the person gets older.
At each successive age, there is less remaining life to fund. Fewer years separate the person from future pension income, and fewer years of spending remain within the plan.
The decline may become particularly visible when a State Pension or workplace pension begins. Before that date, the portfolio may need to cover most of the person's spending. Afterwards, it may only need to fund the remaining gap.
The line does not have to fall smoothly. Changes in future income or spending can alter its shape. A mortgage ending may lower the required capital, while an approaching large expense may slow the decline or temporarily push the frontier higher.
A future expense is considered at every earlier point on the frontier. However, when the expense is still many years away, the capital set aside for it has more time to grow. As the payment approaches, more money may be needed immediately to cover it. Once the expense has passed, it disappears from the remaining plan and the frontier may fall more sharply.
The chart therefore reflects the actual timing of the remaining plan rather than applying one spending multiple to every age.
The frontier is usually easiest to understand in real terms, meaning in today's purchasing power. If the required amount falls from £700,000 to £600,000 in real terms, the remaining plan has become less expensive to fund.
The amounts may look different in nominal terms, which means the cash value expected in the relevant future year. Inflation can make the nominal amount stay flat or even rise while the real requirement is falling.
For example, £700,000 today may have more purchasing power than £800,000 several years from now. Looking only at the future cash number can therefore make the target appear to increase when the economic requirement is actually declining.
Comparing the frontier with projected wealth
The capital frontier answers how much money would be required at each age. A second calculation is needed to estimate how much money the person may actually have by then.
If they continue working, saving and investing, their future wealth will also depend on market returns. It can therefore be shown as a range of possible paths rather than as one straight line.
This range is called a wealth projection. In simple terms, it is the projected evolution of the person's savings if they continue following the current plan.
The projection begins with today's known wealth and gradually opens into a fan. Strong investment scenarios appear towards the top, difficult scenarios towards the bottom and the middle line shows the central outcome.
Placing the capital frontier on the same chart connects the two sides of the retirement question:
- The frontier shows how much is needed to stop working.
- The fan shows how much the person may have if they continue working.
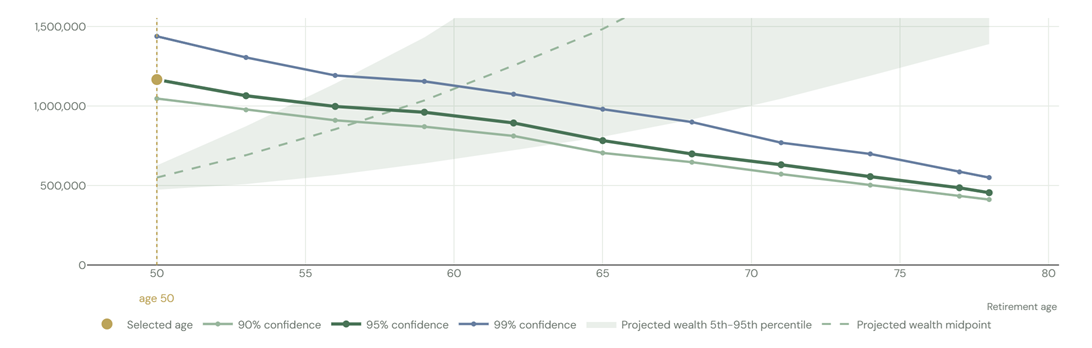
Consider the same example shown above, and the same person is earning £55,000 a year after tax and still spending £35,000, with both amounts increasing with inflation. Employment income continues until age 65, and the annual surplus is invested in a taxable account currently holding £500,000 with no unrealized capital gain.
At any future age, a projected wealth path that lies above the selected frontier has accumulated enough capital to retire with that chosen confidence level.
Suppose the middle wealth path crosses the 95% frontier at age 59. Under the central accumulation scenario, the person reaches the amount required for a 95% retirement success rate at that age.
If a lower wealth path crosses it at 62, continuing to work until 62 provides a stronger buffer against disappointing returns during the saving years.
If most of the fan remains below the frontier until 65, the current contribution and spending assumptions make earlier retirement difficult.
The intersection is not a fixed retirement date. It shows how the possible retirement date changes depending on the investment path experienced before retirement.
How to read the combined chart
The combined chart separates two questions that are often mixed together.
The first is:
If I have this amount at a given age and stop working, how likely is the plan to fund all future spending?
The capital frontier answers this question. A point on the 95% line represents enough starting capital for 95% of the simulated retirement paths to remain funded.
The second is:
If I continue working and saving, how likely am I to have reached that amount by the chosen age?
The wealth fan answers this question. The proportion of projected paths above the frontier shows how often the person reaches the target under the current accumulation plan.
A person may have a very robust retirement plan once they reach £700,000, but only a small chance of accumulating £700,000 by age 55. The capital target and the chance of reaching it are separate parts of the calculation.
Showing them together identifies both the amount required and the range of ages at which that amount may realistically become available.