
How Does a 1% Investment Cost Impact Your Retirement?
 Lorenzo Foti
Investors often spend a great deal of time thinking about investment strategies and what to invest in.
They compare funds, follow market trends, look for promising sectors and consider whether it is the right moment to buy or sell.
On the other side, the annual cost of investing may receive less attention, particularly when the difference appears to be only one percentage point.
A 1% cost sounds small because 1% is a small number. It may also appear minor beside an expected investment return of 7% or 8%.
The effect changes when that percentage is placed in the context of a long-term financial plan. The cost is applied repeatedly, usually to the full amount invested, and continues during both positive and negative market years.
An extra 1% is therefore one of the few parts of an investment outcome that can be known in advance, while the additional return that might compensate for it remains uncertain.
How annual investment costs work
An annual investment cost is generally charged as a percentage of the money invested.
If a portfolio is worth €100,000, a 1% annual cost is approximately €1,000. If it grows to €500,000, the same percentage represents approximately €5,000 a year.
The actual amount changes with the value of the portfolio. When investments rise, the cost in euros increases. When they fall, the cost becomes smaller because it is applied to a lower balance, but it is still charged.
The cost also applies independently of performance. If a fund gains 10% before costs, the investor receives a lower net return after fees. If the fund loses 10%, the cost adds to that loss.
Some charges are taken directly from the investment fund and are gradually reflected in its unit price. The investor does not usually see a separate payment leaving the account; the fund simply delivers a lower return after costs.
Other charges, such as platform or advice fees, may be taken from the cash held in the account or funded by selling a small number of investments.
The precise mechanism can vary, but the result is the same: part of the portfolio is removed each year and can no longer support future growth or spending.
What is included in the total cost?
The headline charge of an individual fund may represent only one part of the overall cost of investing.
The total annual cost can include the charge applied by the fund or ETF, the fee for the investment platform, the cost of financial advice or discretionary management and charges associated with a pension, insurance product or other investment structure.
For example, an investor might pay:
- 0.25% for the underlying funds;
- 0.30% for the platform or pension provider;
- 0.75% for ongoing advice or portfolio management.
The total recurring cost would be 1.30% a year.
Trading commissions, foreign-exchange charges, bid-offer spreads and one-off setup or exit fees may create additional costs. These do not always appear in the quoted annual percentage, so they may need to be considered separately.
For long-term planning, the most useful input is the all-in annual cost: the combined recurring percentage removed from the portfolio each year.
The comparison in this article holds the investment strategy, gross market returns, taxes, income and spending constant. Only the annual cost changes, allowing its financial effect to be isolated.
Whether a service provides enough value to justify that cost is a separate question.
The compounding effect of an extra 1%
Consider an illustrative example of €100,000 invested for thirty years. Assume that the investments earn a constant return of 6% a year before costs, with no further contributions or withdrawals.
With annual costs of 0.2%, the approximate return after costs is 5.8%. After thirty years, the portfolio grows to around €543,000.
If the annual cost rises by one percentage point to 1.2%, the return after costs falls to approximately 4.8%. The final portfolio is around €408,000.
At a cost of 2.2%, it reaches approximately €306,000.
| Annual investment cost | Value after 30 years | Total value lost due to costs 1 |
|---|---|---|
| 0.2% | €543,000 | €32,000 |
| 1.2% | €408,000 | €166,000 |
| 2.2% | €306,000 | €268,000 |
The difference between 0.2% and 1.2% is one percentage point a year. Over thirty years, it reduces the final portfolio by around €135,000, or approximately 25%.
The investor has not simply paid the annual fees. Each fee also removed money that could have remained invested and generated returns in later years.
A euro charged in the first year loses almost thirty years of potential growth. A euro charged in the final year loses very little future growth. Repeating the charge every year creates a compounding effect.
This example shows the difference in final wealth. Retirement planning allows us to translate it into more practical outcomes: the ability to fund spending, the age at which work can end and the capital required to retire safely.
One retirement plan, three cost levels
Consider a person who is currently 45 and has €150,000 invested.
They earn €50,000 a year after tax and spend €35,000, with both amounts increasing with inflation. The remaining €15,000 is invested each year.
They plan to retire at 65. From age 70, they expect a State Pension worth €15,000 a year in today’s purchasing power. Their portfolio contains 60% shares and 40% bonds, and the financial plan runs until age 95 2.
All figures are expressed in today’s money.
We can simulate the same plan using three different all-in annual costs:
- 0.2%: a low-cost reference case;
- 1.2%: one additional percentage point;
- 2.2%: two additional percentage points.
For reference, an ESMA research 3 shows that the actual cost of investing in EU retail funds usually ranges from 0.5% to 2.8% annually, although lower cost and diversified alternatives are available.
Every other assumption in the plan remains unchanged. The simulations use the same market paths, so the difference between the results comes only from the cost.
There are four different ways of describing the effect of the investment cost.
1. The effect on plan success
In this experiment, retirement age and spending are unchanged.
The person retires at 65 and continues spending €35,000 a year adjusted for inflation. The State Pension begins at 70, reducing the amount that must be withdrawn from investments.
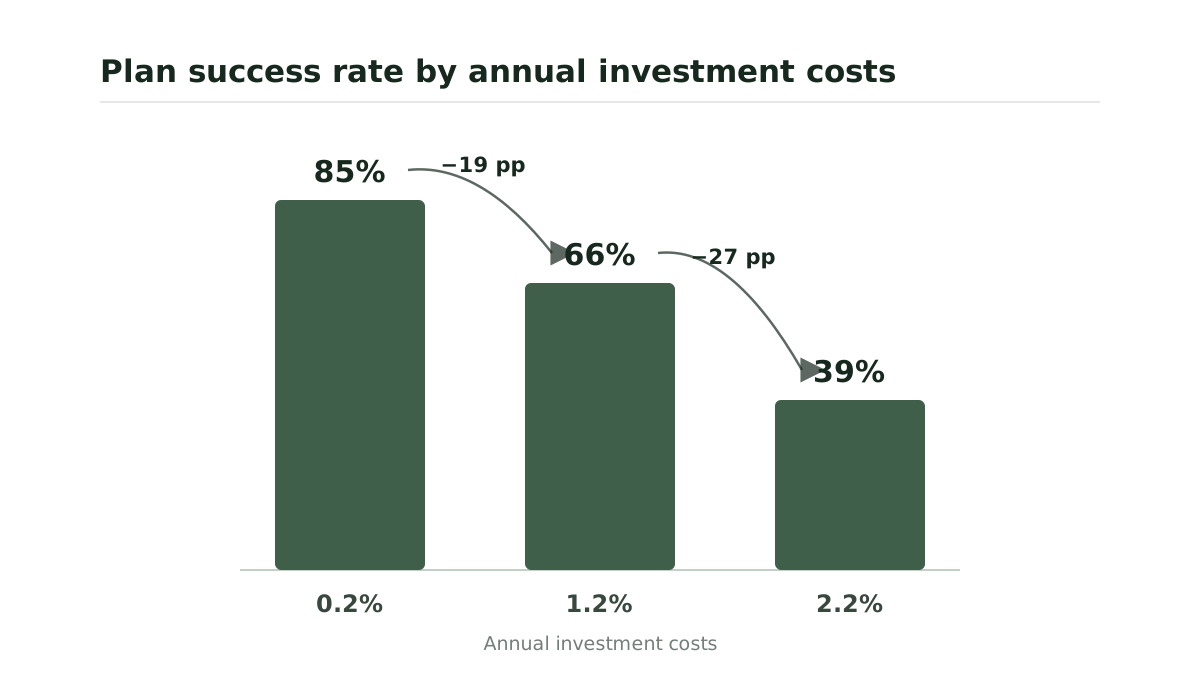
With annual costs of 0.2%, the plan can fund all expected spending in approximately 85% of the simulated futures.
At 1.2%, the success rate falls to around 66%. At 2.2%, it falls further to approximately 39%.
The cost reduces wealth in every scenario, and the effect on the success rate is extremely visible.
Nothing about this person's life changed between the three scenarios. Not the salary, not the savings, not the spending, not the markets. The plan went from likely to work to more likely to fail than not.
2. The effect on retirement age
Now, let's keep the desired spending unchanged and ask when the person could retire with a 95% probability of funding the full plan.
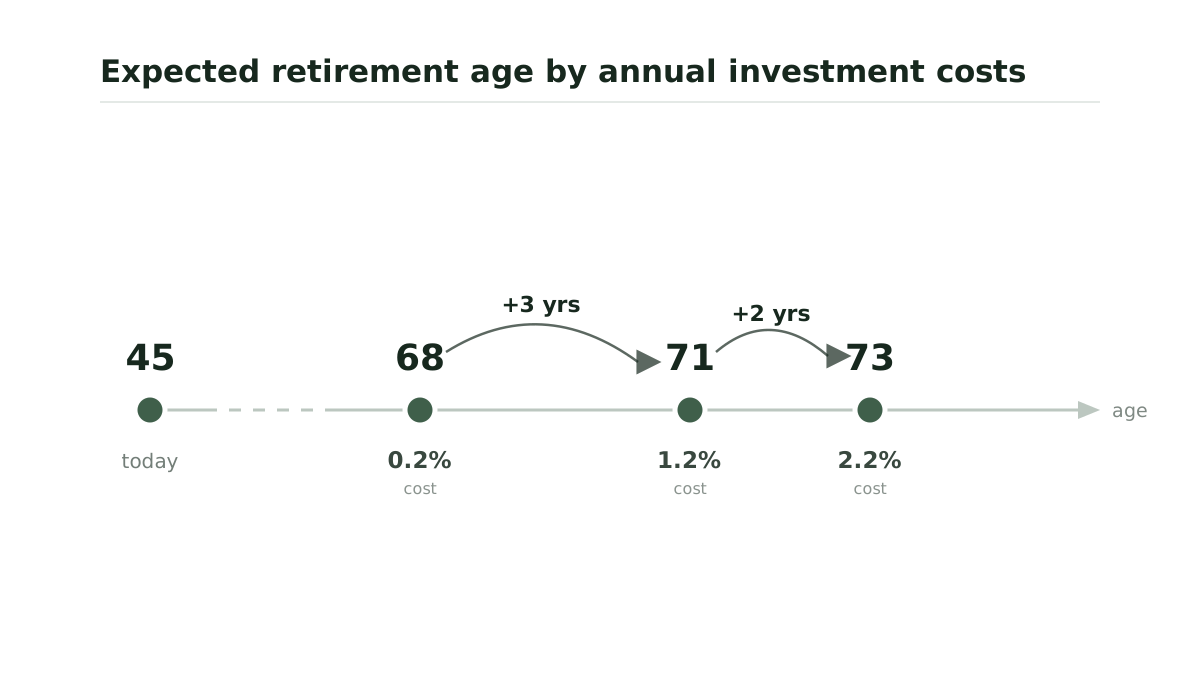
With costs of 0.2%, the required level of confidence is reached at approximately age 68.
At 1.2%, it is reached at around age 71.
At 2.2%, the person may need to work until approximately age 73.
The exact difference depends on the plan, but this translates an annual percentage into time.
Higher costs reduce the wealth accumulated before retirement. They also increase the amount needed to fund spending after retirement. The person therefore approaches a higher target with a portfolio that has grown more slowly.
The financial cost of one additional percentage point can therefore be expressed as several additional years before the plan reaches the same level of confidence.
Those extra years are the expensive part of the bill. The years between 68 and 73 are rarely spare time — in most plans they are the first genuinely free ones, the slot people have in mind when they talk about planning that long awaited holiday, spending a full spring somewhere warm instead of a week, finally giving proper attention to the house, the garden, a grandchild who is at the good age right now.
3. The effect on sustainable spending
Another option is to keep retirement at age 65 and adjust the sustainable spending throughout the entire plan - including the working years.
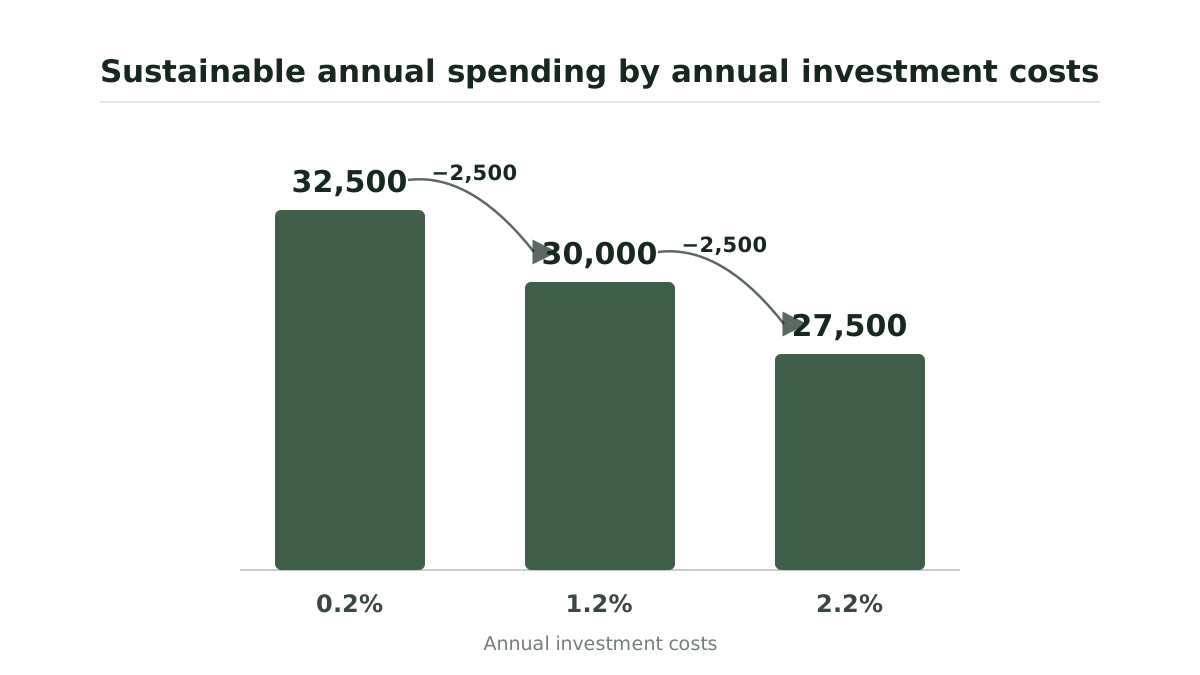
At a 95% confidence level, the low-cost scenario supports annual spending of approximately €32,500 adjusted for inflation (€2,500 less than the original plan in order to reach a 95% probability of the plan).
With annual costs of 1.2%, sustainable spending falls to around €30,000.
At 2.2%, it falls further to approximately €27,500.
The difference is experienced through the person’s lifestyle rather than through the final account balance. This difference in spending will impact the entire 50 years of planning horizon.
It may mean less discretionary travel, fewer gifts, a smaller housing budget or less capacity to absorb unexpected expenses. If essential costs are already high, there may be limited flexibility to make those reductions.
The sustainable-spending result also shows why comparing fees only with the expected investment return can feel abstract. The cost is ultimately paid through the goods, services and experiences that the portfolio can no longer support.
4. The effect on required capital
The same impact can be viewed from the other side of the calculation.
Suppose the person wants to retire now at 45, spend €35,000 a year adjusted for inflation and achieve a 95% probability of funding the plan.
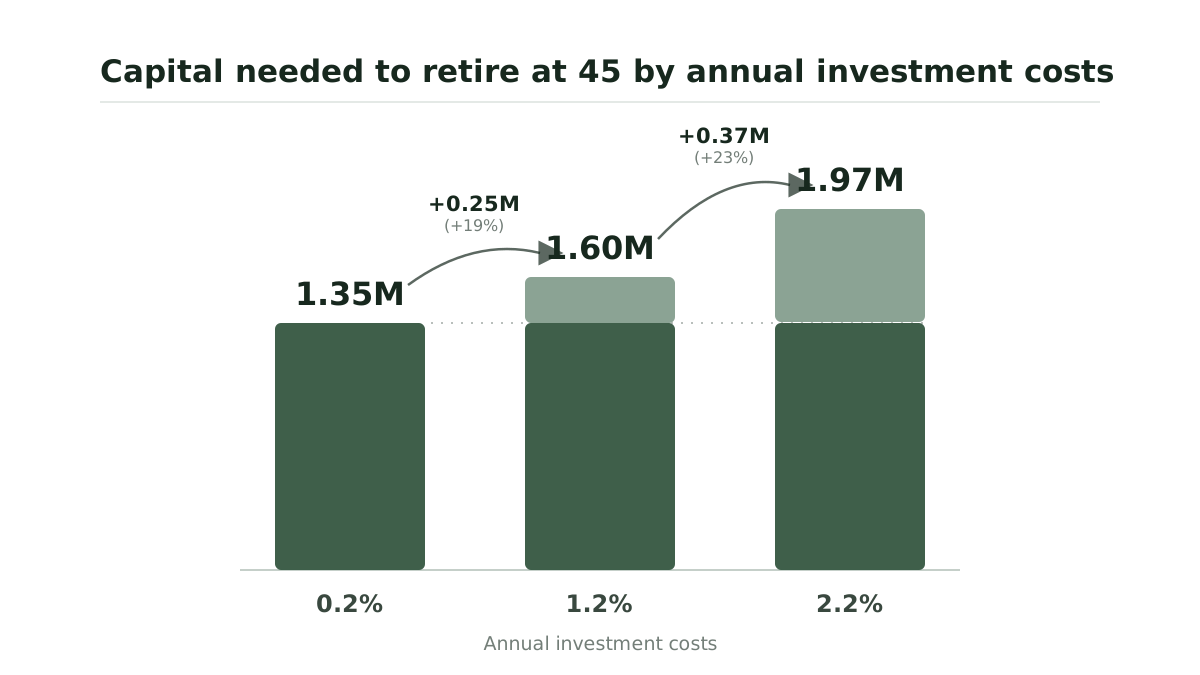
With costs of 0.2%, the required capital would be approximately €1.35 million.
At 1.2%, the capital rises to around €1.6 million.
At 2.2%, the requirement exceeds €1.97 million.
The capital frontier shows how much money is needed at a given age for the remaining financial plan to succeed at the selected confidence level. Higher costs raise the frontier because more starting capital is needed to fund the same future spending.
An additional 1% does not change the desired lifestyle, pension income or retirement length. It changes the amount of wealth required to pay for them.
Why the impact becomes so large
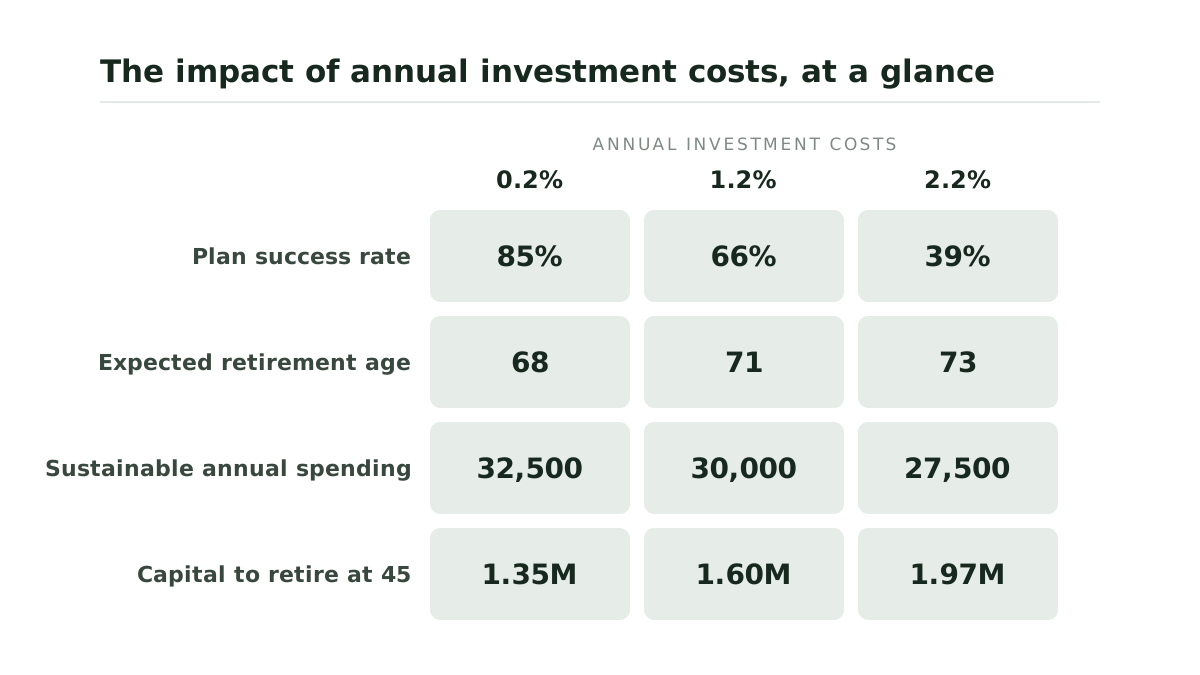
The examples above all describe the same mathematical effect from different angles, and are specific to the example described.
But what are the rationales for such a significant impact?
The cost applies to the whole portfolio
A 1% charge is applied to the amount invested, rather than only to the profit earned during the year.
On a €1 million portfolio, 1% represents approximately €10,000 a year. The charge is still made if the market return is zero or negative.
As the portfolio grows, the annual amount paid also grows.
The lost money stops compounding
Every euro charged is removed from the investment portfolio.
The effect includes both the original fee and the future returns that money could have generated. Over several decades, this lost growth can become larger than the visible charges themselves.
This is why the difference between two portfolios gradually widens, even when the annual gap between their net returns remains constant.
Costs apply during accumulation and retirement
During the working years, fees reduce the amount of wealth being built.
After retirement, they continue while the same portfolio is funding withdrawals. This is particularly important because the retiree is already removing money for spending.
Investment costs and withdrawals are therefore drawing from the portfolio at the same time. During difficult market periods, both continue to reduce the remaining balance.
One percentage point can represent a large part of the real return
Suppose a portfolio earns an average return of 6.5% a year before costs and inflation averages 2%.
The portfolio is growing by roughly 4.5% a year in terms of purchasing power before investment costs.
An additional annual cost of 1% absorbs close to 25% of that real return. If markets perform badly, the impact can get significantly larger.
The number looks small when compared with the total portfolio. It looks much larger when compared with the portion of the return that actually increases future purchasing power.
The effect will depend on the gross return, inflation and length of the plan, but the comparison explains why one percentage point can materially change long-term outcomes.
Always consider the value for money
A higher cost may pay for services that the investor values.
These might include financial planning, tax support, portfolio management, withdrawal planning, behavioural guidance or help with complex family and retirement decisions.
The relevant comparison holds every other benefit constant. If two arrangements provide the same investment outcome and the same service, the one costing an additional 1% leaves significantly less money available for the investor’s goals.
Where the more expensive option provides additional value, that value can be compared with the financial effect of the fee.
A service costing one percentage point a year must compensate for that cost through some combination of better net returns, lower taxes, fewer investment mistakes, more effective planning or benefits that the investor considers worth paying for.
The cost does not automatically determine whether the service is worthwhile. It determines how much value the service needs to create.